Wednesday, December 27, 2017
A Good Start Of The New Portfolio
A new precious metals portfolio for 2018 has been launched. Since the inception (December 20,2017) the portfolio has returned 6.0% while the broad precious metals market, represented by GDX, delivered a mere 2.9%. A good start into the next year, indeed.
Thursday, December 21, 2017
My Proposal For 2018
As announced - the 2018 edition of Precious Metals Portfolio and Newsletter is ready. Here are the details of my proposal:
Proposal
Proposal
First of all, I have decided to continue my investing experiment (Precious Metals Portfolio) initiated in December 2015. However, this time I want
to offer you something a little bit different. Namely, my service can be
divided into two parts: a standard portfolio and a newsletter.
2018 Precious Metals Portfolio
This year I am going to expand my
portfolio to maximum ten picks. Generally, I am not a big fan of
diversification but, to protect the
portfolio against big price swings, I have decided to place between five and
ten picks in the portfolio. So, the rule is: minimum five, maximum ten picks.
What is more, I am going to bet
on a few picks indirectly related to the precious metals sector, as, for
example, streaming or mineral drilling companies. However, do not be afraid
because the gold / silver producers will always constitute the main part of the
portfolio.
Similarly to the 2017
portfolio, this year’s portfolio will be actively managed. It means that from
time to time I will exchange certain picks for new ones (for free). What is more, I am
going to be more active this year – you will receive an update once a month at
least (but it does not mean that I am going to get crazy and exchange my picks
every month…not at all – I am still a long-term investor).
Now, the price. The existing (2017) subscribers are asked to pay $60 (sixty US dollars) for the annual subscription but the new ones (those that have not subscribed to the 2017 portfolio) are asked to pay $75 (seventy five US dollars).
Newsletter
Each newsletter will consist of two parts: “Portfolio”
and “Discussion”:
- Portfolio – simply, it is 2018 Precious Metals Portfolio discussed in the section “2018 Precious Metals Portfolio”
- Discussion – in each issue of my newsletter I am going to deal with at least one new idea. Very often it will be a BUY, SELL, AVOID or HOLD recommendation but I cannot rule out something different. Apart from that, in this section you may find other issues, as, for example, my comment on the current state of the market, unusual situation I have spotted in the precious metals market etc. However, the main content is definitely a new idea.
Similarly to 2018 Precious Metals
Portfolio, you will get at least one issue of Newsletter a month.
Just to be clear – if you are
interested in the portfolio only, do not subscribe to Newsletter (subscribe to 2018
Precious Metals Portfolio in that case). However, if you are interested in the
portfolio and new ideas – subscribe to Newsletter (you will find both in
Newsletter).
Newsletter’s price is $120 a
year for the 2017 subscribers and $150 for new ones. Why such a price? Let me put it in
this way: in the case you are a new subscriber you pay $150 and receive this:
·
2018 Precious Metals Portfolio worth $75 a year
· "Discussion" worth another $75 a year. Or, using
different wording, one new idea worth $6.25 a month (or even less in the case
there are additional issues of Newsletter)
Alright, both services (Portfolio
and Newsletter) are ready to dispatch – just go to the appropriate section ("Services
– 2017 Subscribers” or "Services - New Subscribers") and then choose “2018 Precious Metals Portfolio” or “Newsletter” buttons
and make an appropriate payment. Then, as soon as possible, you will get the
report you have ordered.
Last but not least – all fees are non-refundable. The rule is simple - you make one annual payment and I care about the rest until the end of 2018...
Wednesday, December 20, 2017
Two New Services Incoming
This week I am going to start two new paid services: Portfolio and Newsletter. The details will be announced soon.
Saturday, December 16, 2017
Silvercorp - They Are Buying...At Last
Silvercorp (SVM) is repurchasing its shares. At last. Well, I am really touched - the company fulfills its promises and has started its buy-back program.
According to the latest statement, it has repurchased as many as 788 thousand shares since November 23, 2017 (when the program was announced). I have no idea whether a recent jump in Silvercorp share prices is attributable to the buy-back program but...why not? Look at the chart below:

source: Stockcharts.com
Summarizing - since the start of the buy-back program as many as 12.2 million shares of Silvercorp have changed hands at the Toronto Stock Exchange with 6.5% of this turnover being attributable to the program.
Wednesday, December 13, 2017
It Looks Like Silver Is Bottoming
Commitments of Traders reports are, in my opinion, a very helpful tool to measure the traders' sentiment. Let me take the silver market as an example. Here is the chart documenting historical movements in silver prices, starting from the beginning of 2016:

source: Stockcharts.com
Let me analyze two latest legs down during the current bull market cycle in precious metals (please, forgive me for calling this flat market a bull cycle - I am an incurable gold bug).
Leg down number 1
The first move is marked with the red arrow. It started in middle April 2017 and ended in early July. During that period (a 16.8% drop in silver prices) the Money Managers (big speculators trading silver futures) increased their gross short positions by 42.9 thousand contracts and cut their gross long positions by 54.5 thousand contracts. As a result, a net long position held by these speculators dropped by a huge amount of 97.4 thousand contracts.
Leg down number 2
The second move (blue arrow) dragged silver prices from $18.2 to $15.7 per ounce (a drop of 13.7%) but this time the shorts (Money Managers holding gross short positions in silver futures) increased their short bets by 17.7 thousand contracts and the longs (Money Managers holding gross long positions in silver futures) cut their exposure by 13.1 thousand contracts. As a result, a net long position held by Money Managers went down by 30.8 thousand contracts.
Thesis: the latest leg down in silver was accompanied by significantly lower selling pressure among big speculators trading silver futures. So, if I am correct, we may be ahead of another strong move up in silver prices. What is more, now Money Managers hold a net long position of 21.6 thousand contracts. It means that this group of players is less pessimistic than during the bottom established in the beginning of July (a net short position of 6.4 thousand contracts). Lower pessimism at similar prices may be an indication of an ending bear cycle.
Last but not least. Here is the chart documenting this year's silver flows reported by the iShares Silver Trust (SLV):
 source: Simple Digressions
Note that in December up-to-now as many as 9.6 million ounces of silver were added to SLV vaults. Well, it is not a common pattern. Usually, SLV reports silver inflows during bull cycles. Most often (but it is not a strict rule) during bear cycles the silver goes out of SLV so...this time is a little bit different.

source: Stockcharts.com
Let me analyze two latest legs down during the current bull market cycle in precious metals (please, forgive me for calling this flat market a bull cycle - I am an incurable gold bug).
Leg down number 1
The first move is marked with the red arrow. It started in middle April 2017 and ended in early July. During that period (a 16.8% drop in silver prices) the Money Managers (big speculators trading silver futures) increased their gross short positions by 42.9 thousand contracts and cut their gross long positions by 54.5 thousand contracts. As a result, a net long position held by these speculators dropped by a huge amount of 97.4 thousand contracts.
Leg down number 2
The second move (blue arrow) dragged silver prices from $18.2 to $15.7 per ounce (a drop of 13.7%) but this time the shorts (Money Managers holding gross short positions in silver futures) increased their short bets by 17.7 thousand contracts and the longs (Money Managers holding gross long positions in silver futures) cut their exposure by 13.1 thousand contracts. As a result, a net long position held by Money Managers went down by 30.8 thousand contracts.
Thesis: the latest leg down in silver was accompanied by significantly lower selling pressure among big speculators trading silver futures. So, if I am correct, we may be ahead of another strong move up in silver prices. What is more, now Money Managers hold a net long position of 21.6 thousand contracts. It means that this group of players is less pessimistic than during the bottom established in the beginning of July (a net short position of 6.4 thousand contracts). Lower pessimism at similar prices may be an indication of an ending bear cycle.
Last but not least. Here is the chart documenting this year's silver flows reported by the iShares Silver Trust (SLV):

Note that in December up-to-now as many as 9.6 million ounces of silver were added to SLV vaults. Well, it is not a common pattern. Usually, SLV reports silver inflows during bull cycles. Most often (but it is not a strict rule) during bear cycles the silver goes out of SLV so...this time is a little bit different.
Friday, December 8, 2017
Look What They Have Done To Gold
According to the Commitments of Traders report, during the week that ended on December 5, 2017, Money Managers (big speculators trading gold futures) totally changed their attitude to gold. Look at the chart below:

As the chart shows, a net long position held in gold futures by Money Managers was reduced by 64 thousand contracts in just one week!
What is more, it was the highest reduction in a net long position in history. Simply put, suddenly the gold traders threw in the towel. In my opinion, it looks like a panic and, as usually, panics create buying opportunities.
The red rectangle points to other sudden and big reductions in net long positions held by Money Managers. Each time there was such a drop the prices of gold were recovering.
Last week this change was the highest in history (the blue circle) so the chances for a short move up are relatively high.
I have not written about gold on this blog for quite a long time but believe me - I was not optimistic about the yellow metal. Now I am getting optimistic, at least in the short term.
Wednesday, December 6, 2017
And The Chinese Are Still Buying Gold
The Chinese demand for gold is still strong. Look at the charts below:
In November the Chinese withdrew 189 tons of gold. By the way, more gold was withdrawn only in September (214 tons) and March (192 tons):
 source: SGE and Simple Digressions
As a result, since the beginning of 2017 the Chinese investors withdrew 1,845 tons of gold (an increase of 4%, compared to the same period of 2016):
 source: SGE and Simple Digressions
Once again the Chinese, spotting relatively low prices, invested in gold.
Last but not least - the average annual gold production stands at around 3,000 tons and the Chinese absorb around two thirds of annual production. Year by year...
In November the Chinese withdrew 189 tons of gold. By the way, more gold was withdrawn only in September (214 tons) and March (192 tons):

As a result, since the beginning of 2017 the Chinese investors withdrew 1,845 tons of gold (an increase of 4%, compared to the same period of 2016):

Once again the Chinese, spotting relatively low prices, invested in gold.
Last but not least - the average annual gold production stands at around 3,000 tons and the Chinese absorb around two thirds of annual production. Year by year...
Tuesday, December 5, 2017
Wesdome Gold - An Unlucky Miner
Wesdome Gold (WDO.TO) is an unlucky miner. The company owns an excellent mine, Eagle River, but it also has a big shareholder, Resolute Funds, that some time ago has decided that Wesdome is not a decent investment. As a result, since the end of 2016 Resolute Funds has been selling the company's stocks dragging them down to US$1.4 a share. The charts below document this process:


source: Simple Digressions
Note that initially Resolute was a typical contrarian - the fund was purchasing Wesdome shares when nobody wanted them (until middle of 2013).
Then, after a period of strong accumulation, Wesdome shares started a vicious bull cycle. At that time (middle 2013 - beginning of 2016) these shares were going in the opposite direction than the entire precious metals market.
The start of a bull market in precious metals (December 2015 / January 2016) made this bull cycle even stronger. In between (2016) there was a proxy battle between the company and Resolute Funds which resulted in another strong bull wave.
Then, in 1Q 2017 the shares topped and entered a bear cycle. This cycle is still intact and it looks like it is fuelled by Resolute selling Wesdome shares.
Summarizing - Wesdome is a decent miner (I particularly like its Eagle River mine which is located in an established gold camp in Canada) but as long as Resolute is throwing the company's shares in the towel it is hard to expect an end of the current bear cycle.
Monday, December 4, 2017
Another Mineral Drilling Company Reports Decent Quarterly Figures
Another mineral drilling company, Major Drilling (MDI:TO; MJDLF:OTC Markets), delivered decent 3Q 2017 results. For example, cash flow from operations (excluding working capital issues and taxes) was the highest since 3Q 2015:

source: Simple Digressions
Another sector measure, ARPOR (average revenue per operating rig), also went up:
 source: Simple Digressions
The green rectangles depict boom times while the red ellipses are attributed to poor business conditions.
The yellow rectangle points to the period 2016 - 2017, which, in my opinion, is another boom time.

source: Simple Digressions
Another sector measure, ARPOR (average revenue per operating rig), also went up:

The green rectangles depict boom times while the red ellipses are attributed to poor business conditions.
The yellow rectangle points to the period 2016 - 2017, which, in my opinion, is another boom time.
Thursday, November 30, 2017
Drilling Companies Lead The Precious Metals Market
Despite precious metals and gold / silver mining stocks going flat this year so far, the drilling sector performs quite nicely:

source: Simple Digressions
To remind my readers - the DRILL index comprises the shares of the following drilling companies: Energold Drilling, Major Drilling, Orbit Garant, Geodrill and Capital Drilling.
Note that the index can be considered as a leading indicator for the precious metals sector. For example, since March 2011 the DRILL index was under-performing against one of the most popular gold mining ETFs, GDX (the red arrow). For those that do not remember - gold made a top in middle 2011 and GDX topped in late 2011 but the DRILL index was at that time in its full-gear bear market phase.
Then, since the end of 2012 the index was flat against GDX, gold etc.(the violet rectangle) sending a message that not all things were that bad as many thought.
Now we have a very weak bull market in precious metals but the DRILL index is performing much better than GDX (the blue arrow). So, once again, the message is clear - the bull market in precious metals is still alive.
Tuesday, November 28, 2017
Are We In A Bull Or A Bear Market In Precious Metals - Two Misleading Charts
Precious metals flows data, delivered by popular gold / silver ETFs, can be very misleading. For example, look at these two charts:
iShares Gold Trust (IAU)

source: Simple Digressions and the IAU data
The chart shows gold flows reported by IAU. The red line depicts cumulative flows calculated for the period January 1 - November 27, 2017. It is easy to spot that as many as 1.5 million ounces of gold have been added to IAU vaults this year so far.
Now look at this chart:
iShares Silver Trust (SLV)

source: Simple Digressions and the SLV data
SLV is the world's largest private holder of silver bullion. However, this year this giant recorded a cumulative outflow of 24.2 million ounces of silver.
Now the question is: are we in a bull market or a bear market in precious metals? Or maybe this question is badly-formulated?
Monday, November 27, 2017
To Subscribers To The 2017 Top Five Portfolio
The fifth update to the 2017 Top Five Portfolio was dispatched today (November 27).
If your email box is empty - please, let me know (I will send it again).
If your email box is empty - please, let me know (I will send it again).
Friday, November 24, 2017
To Subscribers To The Top Five Portfolio
Next week (Monday or Wednesday) you will receive a final report on the Top Five Portfolio.
Thursday, November 23, 2017
Silvercorp Announces Another Share Buy-Back
Today Silvercorp Metals announced that it wanted to acquire up to 8.4 million shares. So, once again, the company is announcing a share buy-back program.
To remind my readers, Silvercorp announced three such programs: in 2014, 2015 and now. The first two programs were very ambitious - the company wanted to repurchase around 16 million shares but until March 31, 2016 Silvercorp repurchased a mere 4.0 million shares. Since that time no single share was bought back.
Now they want to purchase "only" 8.4 million shares but...will they do it?
As a matter of fact - they have a lot of cash:

source: Simple Digressions
As the chart shows, at the end of 3Q 2017 the company had cash of $99M. Taking the current share price of $2.51, Silvercrop could repurchase as many as 39.4 million shares (in theory).
Wednesday, November 22, 2017
Energold Drilling - 3Q 2017 Results
Yesterday Energold Drilling released its 3Q 2017 report. Firstly, let me look at the drilling prices reported by two Energold's main divisions: Mineral and Energy:

source: Simple Digressions
The chart on the left shows mineral drilling prices. And it is easy to spot that in 3Q 2017 the prices went up but the increase was much less impressive than in the case of two other drillers I discussed earlier on this blog (Geodrill and Orbit Garant). I guess this slight increase may be explained easily - Energold offers its services at much higher prices than Geodrill and Orbit. Let me compare these prices (as of 3Q 2017):
So, Energold is expensive, compared to Orbit.
As a result, Orbit drilled 404 thousand metres in 3Q 2017 while Energold only 76 thousand metres. Or, using different metric, Orbit delivered a gross margin of C$4.7M while the Mineral Division of Energold delivered a $1.3M.
Let my readers arrive at their own conclusions which driller offers more efficient strategy...*
* I would be very cautious about formulating a final conclusion - it can be tricky

source: Simple Digressions
The chart on the left shows mineral drilling prices. And it is easy to spot that in 3Q 2017 the prices went up but the increase was much less impressive than in the case of two other drillers I discussed earlier on this blog (Geodrill and Orbit Garant). I guess this slight increase may be explained easily - Energold offers its services at much higher prices than Geodrill and Orbit. Let me compare these prices (as of 3Q 2017):
- Geodrill: CS$129 per meter
- Orbit: C$105 per meter
- Energold: C$153 per meter
So, Energold is expensive, compared to Orbit.
As a result, Orbit drilled 404 thousand metres in 3Q 2017 while Energold only 76 thousand metres. Or, using different metric, Orbit delivered a gross margin of C$4.7M while the Mineral Division of Energold delivered a $1.3M.
Let my readers arrive at their own conclusions which driller offers more efficient strategy...*
* I would be very cautious about formulating a final conclusion - it can be tricky
Tuesday, November 21, 2017
Impact Silver - Where Are Your Stockpiles?
After the decent year 2016, this year Impact Silver performs quite poorly. Look at the chart below:
 source: Simple Digressions
Although the production level was generally stable, costs of production were a bit higher this year.
As a result, cash flow from operations (excluding working capital issues) was negative in 3Q 2017:

source: Simple Digressions
Interestingly, it looks like Impact feels very confident about the future. As of the end of September 2017 the company had no stockpiles (to be honest, at the end of 2016 there were also nearly no stockpiles) so any technical problem at one of the mines and...the production is stopped:

source: Impact Silver, 3Q 2017 report, page 9
Sunday, November 19, 2017
U.S. Dollar And Gold
Many people think that the US dollar and gold go in the opposite directions. Well, in many cases it is true but look at this chart:

source: Stockcharts.com
The chart shows that taking 2008 as a starting point (financial crisis of 2007 - 2008), both instruments (gold and dollar) are significantly up:

source: Stockcharts.com
The chart shows that taking 2008 as a starting point (financial crisis of 2007 - 2008), both instruments (gold and dollar) are significantly up:
- gold: 37.1%
- US dollar: 30.7%
Friday, November 17, 2017
Geodrill - Good Figures Once Again
Another drilling company, Geodrill (OTCMKTS:GDLLF), released very good 3Q 2017 figures. To remind my readers, Geodrill is a mineral drilling company operating in Western Africa only (Ghana, Burkina Faso etc.).
In 3Q 2017 the company, similarly to Orbit Garant, reported the highest drilling prices in its history:

source: Simple Digressions
As the middle panel of the chart below shows, direct costs of drilling also went up significantly (due to higher salaries) but...it did not matter. Much better pricing covered higher costs and a gross margin (defined as revenue less direct costs) was one of the highest in history as well:

source: Simple Digressions
Summarizing - another drilling company gives an evidence that the mineral sector (particularly its precious metals segment) does quite well now.
Tuesday, November 14, 2017
It Looks Like The Oil Is Topping Now
According to the latest Commitments of Traders report, Money Managers trading Crude Oil (light sweet) futures increased their net long position in these futures to 340.2 thousand contracts or 13.1% (calculated as the net long position divided by the total open interest):

In that way the LONG oil trade entered the over bullish area.
Note that each time there was excessive optimism among Money Managers (the area marked in light green) oil prices were topping.
It looks like the recent jump in oil prices was driven by the shorts cutting their bets in panic (for example during the week that ended on October 31):

Finally, last week the longs took control over the market (increasing their position by 24.0 thousand contracts) supported by the shorts still cutting their exposure (a cut of 18.3 thousand contracts).
In my opinion, a prudent trader / speculator should avoid the LONG trade in oil now...
Sunday, November 12, 2017
Orbit Garant - The Results Delivered By This Drilling Company Should Satisfy The Gold Bulls
It looks like the bear market in the mineral drilling sector is over. A few days ago Orbit Garant (OBGRF), a small mineral drilling company operating mainly in Canada (this country accounts for 75% of total revenue reported in 3Q 2017), released its 3Q 2017 report.
Look at this chart - in my opinion, it is one of the most important charts I published this year:

source: Simple Digressions
Note that the drilling prices reported in 3Q 2017 were the highest in history. Well, the company is, as always, very cautious about its future (and it should be) but the facts support a bullish thesis on the precious / base metals market - rising prices signal that the industry is definitely recovering.
Despite higher prices, Orbit is able to drill more and more metres:

source: Simple Digressions
Well, higher prices and more work to do result in an impressive jump in cash flow from operations (excluding working capital issues and taxes):

source: Simple Digressions
What is more, as of the end of September 2017 Orbit had the short-term debt of C$16.4M (which was a risk factor) but on November 2, 2017 it signed a new agreement with its lender (which de-risks the company). Let me cite the company (3Q 2017 FS, page 12):
"On November 2, 2017, the Company and the Lender entered into an amended and restated credit agreement that replaces the Credit Facility with a new three-year credit facility, consisting of a $30 million revolving credit facility, a US$3 million letter of credit facility and a US$3 million revolving credit facility"
Now the question is whether Orbit share prices are able to break out above the latest trading range (the red rectangle):

source: Stockcharts.com
Saturday, November 11, 2017
Alio Gold - I Was Wrong
On November 9, 2017 Alio Gold (ALO) released its 3Q 2017 report. As expected, the company delivered the worst results this year but...they were not that bad as I predicted:

source: Simple Digressions
As you surely remember, I projected the 3Q 2017 gross margin of US$1.6M but the company reported a higher figure (US$7.7M).
What happened? Well, I had underestimated Alio - instead of the mining cost of US$3.2 per ton of ore processed, the company recorded the actual cost of US$2.6 per ton of ore.
In other words, I took the average cost of production reported during the latest four quarters but Alio was able to cut it even below the 2Q 2017 figure. So, hats off to the management and shame on me (I was too skeptical).
Unfortunately, the company has cut its 4Q 2017 production guidance from 20 - 22 thousand ounces of gold to 14.5 - 18.5 thousand ounces. The cut resulted in another selling wave:

source: Stockcharts.com
Very likely, the price drop has also something to do with Torex and its problems in the Guerrero State, Mexico.
To remind my readers, Alio is going to build its Ana Paula gold mine in the same, quite dangerous, state so problems at Torex the El Limon - Guajes mine may have a negative impact on Alio.
Tuesday, November 7, 2017
Jaguar Mining - Good 3Q 2017 Results
Today Jaguar Mining (JAGGF; JAG.TO) released its 3Q 2017 report. And, at last, these results were really good. Look at these two charts:
 source: Simple Digressions
Firstly, cash flow from operations has been in a steady increase since 1Q 2017 (the red arrow on the left). Secondly, in 3Q 2017 the company was, for the first time since the end of 2016, able to deliver free cash flow (the panel on the right).
Interestingly, the main contributing factor standing behind these nice results was the Caete mining complex. Here are the charts showing the costs reported by the Caete complex (Pilar + Roca Grande):
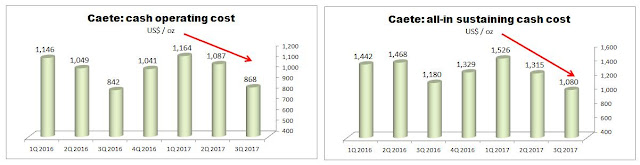
source: Simple Digressions
I particularly like the all-in sustaining cash cost reported by Caete. Now this mining complex produces its gold at the cost of $1,080 per ounce, which is absolutely an outstanding result. Compare this operation to, say, 1Q 2017, when this cost was $1,526 per ounce and Caete was cash flow negative. Good managerial work...
And what about Turmalina, a former flagship property? Well, there is regress at this operation but..it is still quite a decent mine. Look at the all-in sustaining cash costs reported by Turmalina:

source: Simple Digressions
Although the costs are still rising, the current AISC of $1,002 per ounce of gold is not too elevated.
Anyway, most importantly, both operations are now free cash flow positive.
Friday, November 3, 2017
Tesla Motors - Did It Go Too Far?
Quite often financial crises start from a set of events. I have no idea what event is going to ignite another crisis (if there is any crisis) but Tesla Motors fits a crisis scenario very well. Look at these two charts:
The first chart shows Tesla's net debt (defined as debt less cash) and free cash flow (defined as cash flow from operations less investment spending):

source: Simple Digressions
Note: free cash flow reported during 3Q 2017 YTD is the sum of free cash flows reported in 1Q, 2Q and 3Q 2017
As the chart shows, the higher net debt the higher negative free cash flow, which is a nice recipe for severe financial problems.
The second chart shows cash flow from operations before working capital adjustments. In other words, it shows cash flow delivered by Tesla's core business:
 source: Simple Digressions
Note that this year up to date the company has generated lower cash flow than in 2016. Of course, the fourth quarter may be totally different but during first three quarters of 2016 Tesla delivered cash flow of $471.6M, which was a slightly higher figure than that reported this year ($420M). So there is some regress anyway.
To be honest, I like Elon Musk. He is a visionary but as far as financial issues are concerned such a company as Tesla has to be led by a hardball financial officer. A quick look at Tesla's balance sheet makes me wondering whether there is any financial officer at all.
Summarizing - it looks like the whole world (banks, investors, Tesla's customers etc.) is financing the visions created by Elon Musk. However, the main questions is: Did Tesla go too far?
Last but not least - I am not going to start commenting on other issues than the precious metals market. Not at all. However, any financial crisis should have a positive impact on gold and silver. Simply put - during financial meltdowns the precious metals are safe harbors so Tesla's problems could have an indirect positive impact on gold and silver prices at some time in the future....
The first chart shows Tesla's net debt (defined as debt less cash) and free cash flow (defined as cash flow from operations less investment spending):

source: Simple Digressions
Note: free cash flow reported during 3Q 2017 YTD is the sum of free cash flows reported in 1Q, 2Q and 3Q 2017
As the chart shows, the higher net debt the higher negative free cash flow, which is a nice recipe for severe financial problems.
The second chart shows cash flow from operations before working capital adjustments. In other words, it shows cash flow delivered by Tesla's core business:

Note that this year up to date the company has generated lower cash flow than in 2016. Of course, the fourth quarter may be totally different but during first three quarters of 2016 Tesla delivered cash flow of $471.6M, which was a slightly higher figure than that reported this year ($420M). So there is some regress anyway.
To be honest, I like Elon Musk. He is a visionary but as far as financial issues are concerned such a company as Tesla has to be led by a hardball financial officer. A quick look at Tesla's balance sheet makes me wondering whether there is any financial officer at all.
Summarizing - it looks like the whole world (banks, investors, Tesla's customers etc.) is financing the visions created by Elon Musk. However, the main questions is: Did Tesla go too far?
Last but not least - I am not going to start commenting on other issues than the precious metals market. Not at all. However, any financial crisis should have a positive impact on gold and silver. Simply put - during financial meltdowns the precious metals are safe harbors so Tesla's problems could have an indirect positive impact on gold and silver prices at some time in the future....
Tuesday, October 31, 2017
Silver Plays Valuations
Although precious metals are quite weak now, the silver / gold ratio indicates that we are still in a bull market in precious metals:

source: Stockcharts.com
The red arrow on the upper panel of the chart shows gold prices trending slightly down. However, the blue arrow indicates that the silver / gold ratio is going up. In other words, silver is a little bit stronger than gold now and it could be a good time to look at valuations of a few silver plays.
Below I have plotted a popular valuation measure defined as enterprise value (EV) / earnings before interest, taxes, depreciation and amortization (EBITDA):

source: Simple Digressions
Note: EV/EBITDA calculated for Great Panther and Coeur Mining is based on the results reported in 4Q 2016, 1Q 2017, 2Q 2017 and 3Q 2017; other ratios are calculated taking the results reported in 3Q 2016, 4Q 2016, 1Q 2017 and 2Q 2017
Now, look at Hochschild Mining. In my opinion, this company does not deserve to be valued at 5.4 multiple of EV/EBITDA. Due to excellent performance of the Pallancata mine, the operating results reported in 3Q 2017 were really good. And it looks like next year, when the Pablo vein of Pallancata operates at full capacity, the results should be even better.
In my opinion, Hochschild is a buying opportunity now.
Tuesday, October 24, 2017
Gold Bulls - Be Cautious Now
The prices of US 10-year treasury notes are at an inflection point now:

source: Stockcharts.com
The chart above shows gold prices plotted against 10-year treasury notes prices. Note that each time the treasuries are close to their suport (the area marked in orange), gold prices rebound.
Now the treasuries are again at their technical support. However, this time the situation is a little bit different. According to the Commitments of Traders report, big speculators trading treasury notes futures, are cutting their bets on lower or stable market interest rates. For example, last week (I mean the week that ended on October 17), big speculators had cut their gross long positions in treasuries by 73.2 thousand contracts - it was the largest cut since late November 2016.
As a result, a drop below the support is likely now. If that is the case, such an occurrence could spark a big mess around the world with gold prices going down (according to the rule that lower prices of US treasuries (and higher interest rates) have a negative impact on gold prices).
Today treasury prices are below the support (the chart shows the state of the market as of October 23) so...be cautious.
Tuesday, October 17, 2017
Gold Resources - Nice 3Q 2017 Production Figures
Yesterday Gold Resources (GORO) released 3Q 2017 production figures. These figures once again confirm the fact that GORO is a base metals producer and not, as many think, a precious metals producer:

The chart shows that in 3Q 2017 base metals' (copper, lead and zinc) contribution to the total production was 56%.
What is more, the high contribution of base metals should have a very positive impact on the company's results. To remind my readers, this year base metals go up much stronger than gold and silver so...GORO investors should be satisfied.
The chart below depicts the value of metals produced, assuming the average quarterly prices of gold, silver, lead, copper and zinc:

Note that in 3Q 2017 the value of production was the highest this year.
Thursday, October 12, 2017
Impressive Data On The Chinese Demand
Today the Shanghai Gold Exchange (the SGE) released the September data on the gold and silver demand. In my opinion, the Chinese demand for gold and silver is very strong. Here are the appropriate charts:
Gold:

...and silver:

Gold figures are especially impressive - since the beginning of 2017 the Chinese have withdrawn 1.5 thousand tons of gold from the SGE. It means that this year the demand for gold has been substantially higher than last year.
As for silver - despite lower demand than in August, the September data is still impressive (the second largest withdrawal this year up to date)...
Now, although the data disclosed by the SGE has no short-term impact on the prices of precious metals, in the medium and long-term the precious metals are strongly supported by the Chinese investors.
Wednesday, October 11, 2017
Corvus Gold - Update
Last year I published an article on Corvus Gold (it was dispatched in the form of a newsletter). I discussed the North Bullfrog Project and tried to assess the value of the company. Most recently Corvus shares have been rapidly going up so it is time to update my valuation figures. Assuming that nothing has changed, here is the updated calculation:
Equity value = $129.8M
Share value: C$1.30
Today Corvus shares were trading at the price of C$1.30 a share so...they hit my target price.
- value of North Bullfrog: C$128.5M (as in the article)
- Cash at the end of May 2017: C$1.3M
- Debt: null
- Shares outstanding: 99.78 milion (end of May 2017)
Equity value = $129.8M
Share value: C$1.30
Today Corvus shares were trading at the price of C$1.30 a share so...they hit my target price.
Monday, October 9, 2017
Alio Gold - A Quick Look At Its Market Performance
It looks like investors seem to share my positive opinion on Alio Gold (ALO). Since the announcement of 3Q 2017 production figures the company's shares are going up:
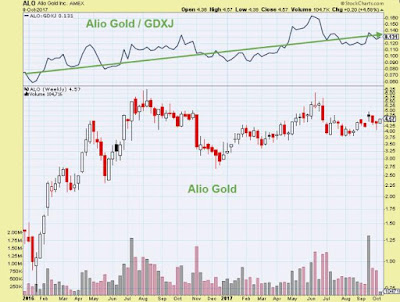
source: Stockcharts.com
What is more important, since the beginning of the current bull market in precious metals Alio has over performed the broad precious metals market represented by GDXJ (look at the upper panel of the chart and the green, up-sloping trend line).
According to the old rule:
If a company releases bad news and its stocks are going up, it may mean that all bad news are priced in.
Friday, October 6, 2017
Alio Gold: Expect Very Poor 3Q 2017 Results
Yesterday Alio Gold (ALO), one of my favorite mining companies, released 3Q 2017 production figures:

source: Alio Gold
Having this data, it is possible to make an estimate of the gross margin delivered by the company in 3Q 2017 (gross margin is defined as revenue less direct costs). My estimate cannot be accurate because I am not able to look into the company's internal figures but...let me try using the average figures.
So, over the last four quarters Alio was processing its ore at an average cost of $9.6 per ton of ore processed. Translating this figure into total material mined (ore + waste) and assuming that the amount of ore processed is equal to the amount of ore mined*, it means that the company was mining its material at the average cost of $3.4 per ton of material (ore + waste) mined.
According to the table above, in 3Q 2017 Alio had to remove 5.2 million tons of waste. To do it the company incurred the cost of $17.8M ($3.4 x 5.2 million tons). Now, to mine the ore Alio had to spend $5.8M ($3.4 x 1.7 million tons) so the total cost of mining was $23.6M ($17.8M + $5.8M).
According to the company, the 3Q 2017 revenue was $25.2M so a gross margin should have been around $1.6M ($25.2M less $23.6M).
For comparison reasons, the chart below shows gross margins, starting from 1Q 2016:
 source: Simple Digressions
Am I bothered about it? Not at all - the company was expecting a very hard quarter so I am not surprised...
* - I cannot be sure about it - generally, some part of ore or waste mined comes from previous quarters

source: Alio Gold
Having this data, it is possible to make an estimate of the gross margin delivered by the company in 3Q 2017 (gross margin is defined as revenue less direct costs). My estimate cannot be accurate because I am not able to look into the company's internal figures but...let me try using the average figures.
So, over the last four quarters Alio was processing its ore at an average cost of $9.6 per ton of ore processed. Translating this figure into total material mined (ore + waste) and assuming that the amount of ore processed is equal to the amount of ore mined*, it means that the company was mining its material at the average cost of $3.4 per ton of material (ore + waste) mined.
According to the table above, in 3Q 2017 Alio had to remove 5.2 million tons of waste. To do it the company incurred the cost of $17.8M ($3.4 x 5.2 million tons). Now, to mine the ore Alio had to spend $5.8M ($3.4 x 1.7 million tons) so the total cost of mining was $23.6M ($17.8M + $5.8M).
According to the company, the 3Q 2017 revenue was $25.2M so a gross margin should have been around $1.6M ($25.2M less $23.6M).
For comparison reasons, the chart below shows gross margins, starting from 1Q 2016:

Am I bothered about it? Not at all - the company was expecting a very hard quarter so I am not surprised...
* - I cannot be sure about it - generally, some part of ore or waste mined comes from previous quarters
Thursday, October 5, 2017
Warren Buffett? No, Thanks.
Is it the end of Warren Buffett's era? Look at the chart below:

source: Stockcharts.com
The chart shows the price action of Berkshire Hathaway shares against the S&P500 index since the beginning of the current bull market in stocks (March 2009). Note that the red arrow goes down, which means that investment in Berkshire has returned less than investment in the broad stock market...
It looks like investing in Warren Buffett's flagship company makes no sense. Mr. Buffett is beaten up by the broad stock market.
Sorry for being nasty...
Tuesday, October 3, 2017
Two Positive Signals For Gold Bulls
It looks like the precious metals market wants to tell us something important. Look at these two charts:

source: stooq.pl
The upper panel shows the relationship between GDX and gold. The lower panel shows gold prices.
Now, since September 27 GDX has been going up (the blue arrow) while gold has been going down (the red arrow). Interestingly, the shares of precious metals mining companies are stronger despite lower prices of gold.
Another ratio, silver to gold, is also sending positive signals with silver being stronger than gold. While the signal sent by the second ratio (silver:gold) are relatively frequent, the signal sent by the first ratio (GDX:gold) is a rare event.
Note that both ratios are sending positive signals despite a stronger US dollar...
Saturday, September 30, 2017
2017 Top Five Portfolio - Update
As of September 29, 2017 the Top Five Portfolio has returned 27.7% since inception (December 12, 2016):

Now me and my subscribers are entering the last phase of this real-time experiment (using George Soros' terminology) so it is a good time to tell you this:
"I am thinking about extending this service into 2018 but, probably, this time I would change the way I am communicating with you. Simply, instead of the updates delivered by email, the subscribers would get an instant access to the material published on a daily basis. It should be a much more effective way of communication. Details should be announced soon..."
Thursday, September 28, 2017
Hochschild Mining - Looks Interesting Now
Hochschild Mining is a mid-tier silver / gold producer operating in South America (Peru and Argentina). The company has been under my radar for years but most recently my interest in this miner has dissipated a little bit. Why? Because Hochschild was one of a few mining companies that hedged their production against lower precious metals prices. What is more, this policy had a negative impact on the company's results. However, in the 1H 2017 report I have found this statement (page 23):
"In 2016, the realized loss on gold and silver swaps and zero cost collar forward sales contracts in the period recognized within revenue was US$3,116,000 (loss on gold: US$3,501,000, gain on silver: US$385,000). There were no forward contracts in the 2017 period"
The most important is the last part of it (bolded) - it looks like Hochschild does not hedge its production any longer (if somebody claims the opposite - please, let me know; maybe I overlooked something... ).
One issue has gone but 1H 2017 results were very disappointing and since middle August 2017 the company shares have been in their strong downward trend:

source: Stockcharts.com
What happened? The first problem is called "Arcata" - now this mine is one of the highest-cost producers for Hochschild:

In 1H 2017 the direct cash cost of production went up by 25.%, compared to 2016 and head grades went significantly down:

Well, the chart shows Arcata's mining sequences (red blocks) and now it looks like the mine has entered another sequence - this time the company is mining in the low-grade zone. Hence, poor results.
Unfortunately, Hochschild does not disclose where it is going to mine silver / gold in the future. The company's comment is quite enigmatic:
"At Arcata, first half, production was 2.9 million silver equivalent ounces (H1 2016: 3.7 million ounces) with tonnage and silver grades adjusted following a revision of the mine plan to accommodate a reduced number of stopes and narrower veins. The focus at Arcata is to improve its cost position by increasing the quality of resources through the brownfield exploration programme as well as other efficiency and productivity measures in order to ensure the long term sustainability of the mine. The forecasts for Arcata’s output for the year have been revised to 5.5 million silver equivalent ounces in 2017"
And another piece:
"In H1 2017, as expected, Arcata’s all-in sustaining cost rose substantially versus H1 2016 to $17.6 per silver equivalent ounce (H1 2016: $13.0 per ounce) reflecting the reduced tonnage and grades resulting from the revised mine plan as well as the previously-announced increased investment in the mine’s brownfield exploration program"
Well, it looks like there is a problem: narrow veins (and probably higher dilution) and higher capital spending (brownfield exploration). In other words, despite the fact that Arcata has been a long-life operation (mining started in 1964), now it is facing troubles...
Another problem: the San Jose mine (shared with Mc Ewen Mining) located in Argentina. This mine, similarly to Arcata, substantially increased the direct cost of production (from $7.6 per ounce of silver equivalent in 1H 2016 to $9.1 per ounce in 1H 2017).
To be honest, it is not easy to explain this increase - head grades and the tonnage processed look alright (grades were even higher than in 1H 2016) so...
The company explains in this way:
"At San Jose, all-in sustaining costs increased to $14.4 per silver equivalent ounce (H1 2016: $11.7 per ounce) mainly due to the elimination of the Patagonian port rebate in the fourth quarter of 2016. In addition, lower than expected currency devaluation in Argentina only partially offset ongoing unit cost inflation. Overall 2017 all-in sustaining costs are now expected to be between $13.5 to $14.0 per silver equivalent ounce"
I am not able to comment on the Patagonian port rebate but as for inflation...yes, it can be a problem. Now the inflation rate in Argentina stands at 23.1% but in 1H 2017 the Peso was just 9.6% weaker against the US dollar, compared to 1H 2016. So inflation could be an explanation...
Of course there are positives - Pallancata, another Peruvian mine, was converted into an excellent operation (direct cost of production of $5.9 per ounce of silver eq.!) and the last mine, Inmaculada, keeps going smoothly.
However, 1H 2017 results were a negative surprise. For example:
Hence, investors panicked and threw in the towel. As a result, now Hochschild shares are trading at quite depressed levels (EV / EBITDA of 6.1).
In my opinion, it is time to get interested in Hochschild once again...
"In 2016, the realized loss on gold and silver swaps and zero cost collar forward sales contracts in the period recognized within revenue was US$3,116,000 (loss on gold: US$3,501,000, gain on silver: US$385,000). There were no forward contracts in the 2017 period"
The most important is the last part of it (bolded) - it looks like Hochschild does not hedge its production any longer (if somebody claims the opposite - please, let me know; maybe I overlooked something... ).
One issue has gone but 1H 2017 results were very disappointing and since middle August 2017 the company shares have been in their strong downward trend:

source: Stockcharts.com
What happened? The first problem is called "Arcata" - now this mine is one of the highest-cost producers for Hochschild:

In 1H 2017 the direct cash cost of production went up by 25.%, compared to 2016 and head grades went significantly down:

Well, the chart shows Arcata's mining sequences (red blocks) and now it looks like the mine has entered another sequence - this time the company is mining in the low-grade zone. Hence, poor results.
Unfortunately, Hochschild does not disclose where it is going to mine silver / gold in the future. The company's comment is quite enigmatic:
"At Arcata, first half, production was 2.9 million silver equivalent ounces (H1 2016: 3.7 million ounces) with tonnage and silver grades adjusted following a revision of the mine plan to accommodate a reduced number of stopes and narrower veins. The focus at Arcata is to improve its cost position by increasing the quality of resources through the brownfield exploration programme as well as other efficiency and productivity measures in order to ensure the long term sustainability of the mine. The forecasts for Arcata’s output for the year have been revised to 5.5 million silver equivalent ounces in 2017"
And another piece:
"In H1 2017, as expected, Arcata’s all-in sustaining cost rose substantially versus H1 2016 to $17.6 per silver equivalent ounce (H1 2016: $13.0 per ounce) reflecting the reduced tonnage and grades resulting from the revised mine plan as well as the previously-announced increased investment in the mine’s brownfield exploration program"
Well, it looks like there is a problem: narrow veins (and probably higher dilution) and higher capital spending (brownfield exploration). In other words, despite the fact that Arcata has been a long-life operation (mining started in 1964), now it is facing troubles...
Another problem: the San Jose mine (shared with Mc Ewen Mining) located in Argentina. This mine, similarly to Arcata, substantially increased the direct cost of production (from $7.6 per ounce of silver equivalent in 1H 2016 to $9.1 per ounce in 1H 2017).
To be honest, it is not easy to explain this increase - head grades and the tonnage processed look alright (grades were even higher than in 1H 2016) so...
The company explains in this way:
"At San Jose, all-in sustaining costs increased to $14.4 per silver equivalent ounce (H1 2016: $11.7 per ounce) mainly due to the elimination of the Patagonian port rebate in the fourth quarter of 2016. In addition, lower than expected currency devaluation in Argentina only partially offset ongoing unit cost inflation. Overall 2017 all-in sustaining costs are now expected to be between $13.5 to $14.0 per silver equivalent ounce"
I am not able to comment on the Patagonian port rebate but as for inflation...yes, it can be a problem. Now the inflation rate in Argentina stands at 23.1% but in 1H 2017 the Peso was just 9.6% weaker against the US dollar, compared to 1H 2016. So inflation could be an explanation...
Of course there are positives - Pallancata, another Peruvian mine, was converted into an excellent operation (direct cost of production of $5.9 per ounce of silver eq.!) and the last mine, Inmaculada, keeps going smoothly.
However, 1H 2017 results were a negative surprise. For example:
- cash flow operations (excluding working capital issues and taxes) went down from $152M in 1H 2016 to $111M in 1H 2017
- free cash flow dropped from $89M to $29M
Hence, investors panicked and threw in the towel. As a result, now Hochschild shares are trading at quite depressed levels (EV / EBITDA of 6.1).
In my opinion, it is time to get interested in Hochschild once again...
Subscribe to:
Posts (Atom)