Tuesday, August 29, 2017

Is Gold Breaking Above $1,300 Per Ounce?

Higher prices of gold and silver should attract investors but it is not always the case. Look at this chart:


Interestingly, this month, despite a 3.6% increase in silver prices, as many as 8.6 million ounces of silver were withdrawn from SLV vaults (and the 2017 cumulative flow is still negative - look at the lower panel of the chart).

However, JPM Morgan warehouse still reports silver inflows and since the beginning of 2017 as many as 33.7 million ounces of silver were added to the bank's vaults. It is a huge amount of silver. For example, Fresnillo plc, the largest world's primary silver producer delivers around 55 million ounces of silver in annual production.

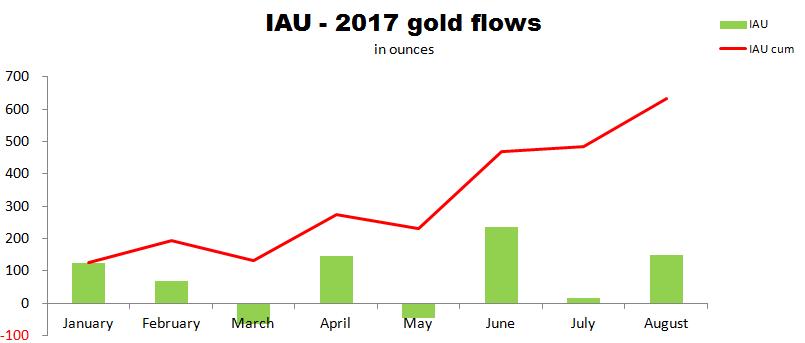
On the other hand, in August two gold trusts, GLD and IAU, added big amounts of gold to their vaults (look at the row indicated by the red arrow on the chart below):

So, generally, August should be a good month for gold bugs. Particularly, this day (August 29) seems to be very interesting for precious metals investors - it looks like gold is breaking above its very strong resistance.

However, in my opinion, to get let reliable confirmation of this move we should wait for a few days...

Tuesday, August 22, 2017

IAU Or GLD? That Is A Question

I closely track gold flows reported by two big gold holders: IAU and GLD.

However, there is a big difference between these two investment vehicles. Look at the charts below:


Green bars depict monthly flows of gold and red lines depict cumulative gold flows.

It is easy to spot that this year investors participating in IAU were accumulating gold (the up sloping red line) while those using GLD were doing the opposite (and as of August 21 GLD reported a year-to-date outflow of gold).

Now the question is: which gold vehicle gives more reliable signals - IAU of GLD?

Monday, August 21, 2017

Who Trades Atico Mining?

I very often wonder who invests in stocks. Let me take an example of Atico Mining, a small copper producer, operating the El Roble mine in Peru.

On August 15 the company released the following info:

VANCOUVER, BRITISH COLUMBIA--(Marketwired - Aug. 15, 2017) - Atico Mining Corporation (the "Company" or "Atico") (TSX VENTURE:ATY) reports a temporary work stoppage at the El Roble mine pending final inspection of the clean water discharge system. The Company will work with provincial authorities to confirm the integrity and safety of the system as quickly as possible, beginning tomorrow August 16, 2017.
Here is the reaction of the market:
 
source: stockcharts.com
Notice that in middle June 2017 Atico shares started an impressive move up - between June 16 and August 14 these shares gained 53.4%.
However, on August 15, since the beginning of the trading day, somebody was desperately selling Atico shares, which resulted in a final drop of 6.7% (blue arrow). It looks like somebody knew about the company's problems.
Then, the next day, when the info was known to everybody, the shares tumbled 13.3% at their selling climax (red arrow).
Summarizing - in just four after this "disastrous" news a decent company lost 14.6% in value.  
Today the company released this info:
VANCOUVER, BRITISH COLUMBIA--(Marketwired - Aug. 21, 2017) - Atico Mining Corporation (the "Company" or "Atico") (TSX VENTURE:ATY)(OTC PINK:ATCMF) is pleased to report that further to the news release announced August 15, 2017, the final inspection by provincial authorities concluded successfully and the operations at El Roble mine have resumed as of August 18, 2017.
So now everything is back to normal. However, a question remains open: who is trading stocks? Who thinks that a minor technical issue, a usual thing in the mining industry, can derail a decent company in just two days?

UPDATE:
Today Atico shares are up 10.5%. My question is still intact - who trades these shares?
 

Saturday, August 19, 2017

Message For The Subscribers To The 2017 Top Five Portfolio

The third update has been dispatched. If anyone did not receive the update - please, let me know (via email or in the "Comment" section)

Friday, August 18, 2017

Gold Is Doing Well But...

Gold is doing well but the latest surge is not supported by another precious metal, silver. Look at this chart:
source: stooq.pl

The today's top (the upper red arrow) is not accompanied by a similar top in the silver / gold ratio (the lower red arrow). It looks like a classic negative divergence indicating a short-term top in gold prices...

Friday, August 11, 2017

Gold Bulls - Watch Out

After an impressive rally, gold prices are very close to generate a sell signal. Look at the chart below:


The lower panel of the chart shows the relationship between gold and US 10-year treasury notes (10 year) prices. It looks like whenever the ratio Gold / 10 year is getting very close to the upper, resistance line, gold is bouncing down.

Tuesday, August 8, 2017

The Drop In Jaguar Mining Share Prices Explained

Now we know who is responsible for the last huge drop in Jaguar share prices - it is Resolute Funds Limited. Here is an excerpt from an appropriate info:


"During the month of July, Resolute in aggregate disposed of 35,000,000 common shares of Jaguar Mining on behalf of the Fund. The dispositions included 4,637,000 shares with a four-month holding period sold to an accredited investor in accordance with applicable securities regulations and which had been acquired by the Fund in a private placement that closed on June 15, 2017. As a result of these dispositions, together with other shares acquired or disposed of previously, the Fund held 2,000,000 common shares of Jaguar Mining at the end of July, 2017, representing approximately 0.62% of all outstanding shares of that class"

I think it is the good news. A shareholder, that I cannot name a smart investor (who disposes the shares in such a nasty way?), is out of the company (nearly). Very fine. Farewell Resolute. And, please, do not touch this company again.

What is more, while selecting mining picks I will be closely checking whether this fund is among company's shareholders. If it is, caution is advised...

Poor Wesdome Gold...(another mining company where Resolute is a big shareholder).

Are Copper Prices Ahead Of A Correction?

It looks like a short-term divergence between copper prices and the copper dollar index is in the making. Look at these two charts:


source: Simple Digressions

To remind my readers, the copper dollar index is built in the same way as the Goldollar index:

"It is calculated by multiplying the price of copper by the U.S. dollar Index and its purpose is to cancel the effects of currency fluctuations on the price of copper. By comparing it with the spot copper dolar index an analyst can determine if there is inherent strength/weakness in the price of copper"

Now, as a rule, copper prices and the copper dollar index go in tandem. However, if there is any divergence between these two instruments, caution is advised.

The two blue arrows on the chart above show this pattern. A few days ago copper prices broke above their resistance at $2.78 per pound but the copper dollar index is still below a similar resistance level. If I am correct, copper may start its correction soon.
  

Monday, August 7, 2017

Richmont Mines - There Is Only One Problem

A few days ago Richmont Mines (RIC) released its 2Q 2017 report. As I expected, the results were excellent. The flagship property, the Island Gold mine, delivered outstanding results. Simply put, there is nothing to comment.

However, the company has one problem, which is called the Beaufor mine. Particularly, costs of production at which the gold is produced at this mine. Look at this chart:


and this one:

source: Simple Digressions

As the charts show, in 2016 Beaufor became a cash flow negative mine. The all-in sustaining cash cost of production (AISC) of C$1,854 per ounce of gold was much above the average gold price received in 2016 (C$1,640 per ounce).

This year the company expects to cut AISC to C$1,565 per ounce of gold but:
  • in 1Q 2017 this cost was standing at C$1,580 per ounce (with gold price received of C$1,624 per ounce - slightly above 1Q 2017 AISC, which was good)
  • in 2Q 2017 the AISC was C$1,791 (once again above the gold price received of C$1,688 per ounce of gold, which was bad)
As a result, in 1H 2017 the average AISC was C$1,682 per ounce of gold while the average gold price received was C$1,659. Simply put, the Beaufor mine was once again cash flow negative (each ounce of gold sold was burning C$23).

It looks like this mine is a big problem to the company's management - the guys are surely scratching their heads on discussions what to do with this mine...anyway, the 2017 Beaufor cost guidance is endangered, in my opinion.

Further, I think that the management should focus on cutting mining costs at Beaufor. Since 2015 these costs, measured on a-per-ton-of-ore-processed basis, have been in their strong upward trend:

source: Simple Digressions

Now, in 2Q 2017 each ton of ore processed at Beaufor was grading 5.21 grams of gold. With recovery rate of 97.7% and price of gold received of C$1,688 per ounce, each ton of ore processed was worth C$276. So the Beaufor mine was very close to its break-even point (as the chart indicates, the cash cost was standing at C$263 per ton of ore).

In other words, with lower and lower grades and higher costs of mining and processing the only thing the company can do is to cut costs. If it is impossible...the only solution is to put the mine on care and maintenance and wait for much higher prices of gold....
 

Friday, August 4, 2017

USD, US Equities And Copper - Are They At Their Pivotal Points?

I am back at my desk. Today I would like to show a few charts with little or no comment.

USD


The chart shows the US dollar sentiment index build on the data delivered by the COT report (Commitments of Traders report), as of August 1, 2017. As the chart shows, there is excessive pessimism among big speculators trading in US dollar index futures.

I guess everybody noticed that today the US dollar went up strongly. Those interested in my sentiment indices - please, go to my Seeking Alpha Marketplace service here.

VIX

The US stock market is unstoppable but...big speculators betting on higher prices of US equities are overly optimistic. The chart below shows a net position held by these traders in VIX futures. A huge net short position held by big speculators means that nearly each speculator bets on higher prices of US equities (lower VIX means higher stock prices).


What is more, the amount of those taking part in the game is the highest in history. Look at the total open interest in VIX futures:


Copper

Most recently copper prices broke above their strong resistance. This breakout was followed by masses participating in this movement. As a result, money managers (another class of big speculators) betting on higher prices of copper became overly optimistic about the red metal:


Similarly to VIX, the amount of players taking part in the game "Let us buy copper" is the highest in history: